It’s straight forward to generate Xdebug profiler output and visualise the bottlenecks associated with running any request that’s run through the PHP stack.
Here’s how you’d install PHP, Xdebug and Kcachegrind (qcachegrind) on OSX 10.9 Mavericks and get some in depth info on your php app.
Install Homebrew
Make sure you have homebrew installed correctly.
The main thing to remember is to add /usr/local/ to your shell’s $PATH. Often it’s best to have it first so it overloads the system’s default applications. brew doctor will complain if this isn’t the case.
Add PHP Packages to Homebrew
PHP packages of OSX are not available to homebrew by default. The homebrew-php repository is the source of truth for PHP related recepies.
The homebrew-php README is verbose, on Mavericks you only need to run the following:
brew tap homebrew/dupes
brew tap homebrew/versions
brew tap josegonzalez/homebrew-php
This will give you access to all the php specific formulas.
Install PHP
Install PHP 5.3.x with the following commands:
brew install php53
Once installation is complete the formula tells you what to add to your httpd.conf to run the libphp5.so. Take note of the location of the php.ini file. The system default location is /etc/php.ini.default.
You can get back to the post-install info of any homebrew package with brew info php53.
# To enable PHP in Apache add the following to httpd.conf and restart Apache:
#    LoadModule php5_module    /usr/local/opt/php53/libexec/apache2/libphp5.so
#
# The php.ini file can be found in:
#    /usr/local/etc/php/5.3/php.ini
Open your apache config at /etc/apache2/httpd.conf and replace the existing (possibly commented out) LoadModule php5_module line with the LoadModule line from above.
Restart the apache process with:
sudo apachectl restart
Notes
I like to add index.php as a DirectoryIndex option. Find the <IfModule dir_module> section of the apache config and add index.php after index.html.
<IfModule dir_module>
    DirectoryIndex index.html index.php
</IfModule>
The arguments passed to the PHP compiler are visible in abstract-php.rb once you have everything running within apache the same variables are shown at the top of the phpinfo(); output under Configure Command.
The relevant options that will pick up the not-yet-installed XDebug config file and the php.ini file are:
def install_args
    args = [
    # ...
    "--with-config-file-path=#{config_path}",
    "--with-config-file-scan-dir=#{config_path}/conf.d",
    # ...
    ]
Install Xdebug
Install the appropriate Xdebug version for php5.3
brew install php53-xdebug
The notes from the installation mention the location of the Xdebug config file.
# To finish installing xdebug for PHP 5.3:
#  * /usr/local/etc/php/5.3/conf.d/ext-xdebug.ini was created,
#    do not forget to remove it upon extension removal.
Restart apache and load up a phpinfo(); page and you should see references to Xdebug.
Configure Xdebug to Generate Profile Data
All Xdebug options are well documented, below are a minimum set of options to get profile data written.
Open the generated ext-xdebug.ini and three configuration options profiler_enable, profiler_output_dir and profiler_output_name.
[xdebug]
zend_extension="/usr/local/Cellar/php53-xdebug/2.2.3/xdebug.so"

xdebug.profiler_enable = 1
xdebug.profiler_output_dir = /Library/WebServer/xdebug-profiler
xdebug.profiler_output_name = "callgrind.%R.%t"
profiler_output_dir- can be any directory, but it must be writable by thehttpdprocess that runs under thewheeluser on OSX systems. By default/Library/WebServeris not writable by many users; so pick your directory appropriately.profiler_output_name- this option can be a format of your choice, the line above will produce files based on the URL, suffixed by a timestamp (callgrind._bh_apiv1_cafes_371_json.1394929295)
When you change these settings, restart apache and the changes should be visible in phpinfo().
If you’re not seeing logs straight away, it’s more than likely a file permissions issue on the output directory.
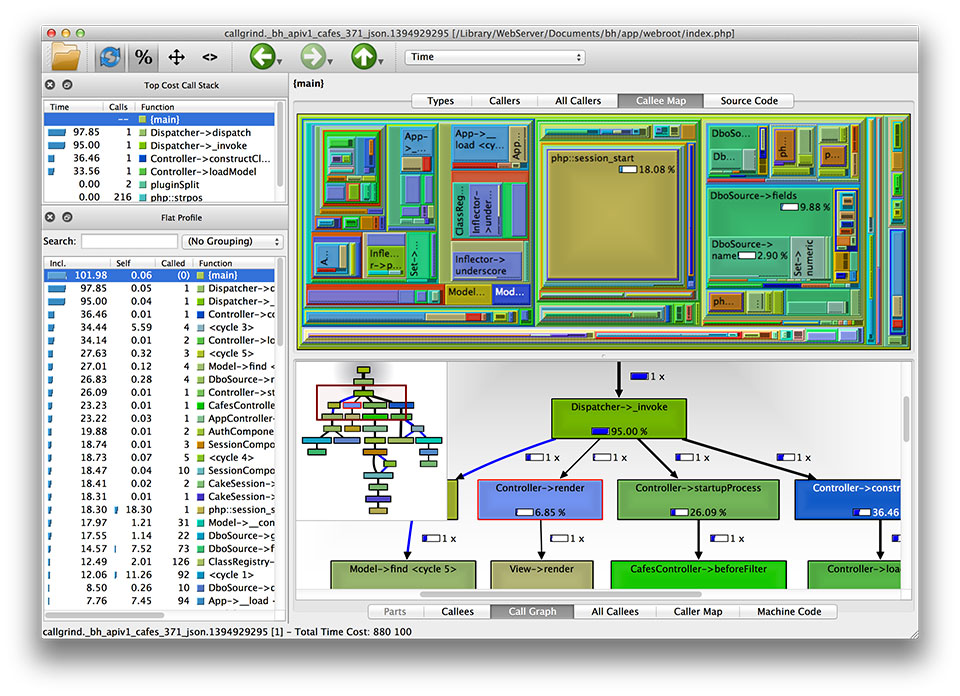
Visualise Profile Data
The preferred way to install kcachegrind on OSX is to install qcachegrind and AppViz. Both components can be installed with homebrew.
Underneath the hood qcachegrind uses graphviz’s dot application to generate the graphs. dot will be available to qcachegrind if you’ve setup your $PATH correctly above.
brew install qcachegrind
brew install graphviz
After installation you should have qcachegrind in your path and you can launch it with the profile files as the first argument.
qcachegrind callgrind._bh_apiv1_cafes_371_json.1394929295